
How to Read the Amazon Search Query Performance Report
The Search Query Performance report counts fewer purchases than your sales reports, and it is built that way. Read it by shares, rates and one call per keyword, and its numbers hold up.
The Amazon Search Query Performance report sits in Brand Analytics in Seller Central, and Amazon shows it only to brands enrolled in Brand Registry. It shows how often shoppers saw, clicked, added to cart and bought products on every search across the whole market and what share of each step went to your brand. Your ad reports only show the searches your ads already reach, while this report shows the whole market on each search.
Sellers often stop trusting it the first time they compare it with their sales. If you are a brand-registered seller who has opened or exported the report and wants to act on it, the reading rules below are the ones I use on the client accounts I manage.
Where to find the report and which view to download
You need Brand Registry and a Professional selling account before the report appears, and you can check your access by hovering over Brands in the main menu of Seller Central and looking for Brand Analytics in the list.
- Open Brands in Seller Central and choose Brand Analytics. Amazon describes that menu on its Brand Analytics tools page, which I read on 1 Nov 2026. Menus move, so check the wording on your own screen.
- Choose the view. Amazon's Brand Analytics article says you can use a Brand View or an ASIN View to dig into the data.
- For one product, use the ASIN view with a child ASIN, which is the product ID of one size or color. Because a variation parent returns an empty file, I pick the child with the most sessions in the Business Report.
- Switch on every column before you export. Seller Central shows 21 of the report's 33 columns by default, and the steps from seen to bought need all of them.
Each weekly file in the ASIN view holds up to roughly 100 searches for one product, so the rarest searches may not show.
Why Search Query Performance purchases don't match your sales
The Amazon Search Query Performance report counts only the purchases that start from an Amazon search. Sales that come from anywhere else stay out of it, so its purchase totals run lower than your Business Report. That gap is how the report is built, and you do not need to fix it or reconcile it.
If you add up the purchases column and compare the total with the Business Report, the file will look broken. Both reports can be right at the same time, because this one counts only the purchases tied to a search.
For that reason I work from shares and rates. Your purchase share on a search is your brand's slice of all the purchases the market made from that search, and because it holds up when the totals do not match, it is the number to compare month to month. When your purchase share on a search rises from one month to the next, you won more of the buyers on it, even if the purchase count in this report never equals your sales.
The same logic applies at every step. Your impression share, click share and cart add share are all slices of what the whole market did on that search. Read them as shares and the report becomes consistent with itself.
How to read the funnel from seen to bought
The report gives you four steps for each search (impressions, clicks, cart adds and purchases) and shows the market's total beside your brand's share at each one. Reading your share step by step shows where competitors win the shopper.
| Step | What your share tells you |
|---|---|
| Impressions | How often your product is seen on that search. A low share means shoppers rarely see you. |
| Clicks | Whether shoppers who see you choose you. A click share below your impression share means they click on others. |
| Cart adds | Whether the product page persuades the shoppers who click. |
| Purchases | How much of the market's buying on that search you win. |
When your click share trails your impression share, shoppers see you and click elsewhere. Before you blame the listing, check your price against the market's and then look at the main image and the title. When shoppers click and don't buy, the checklist moves on to reviews, A+ content and the offer.
My Deep Analysis reads the top 50 unbranded searches this way every month and compares the brand's share with the market's at each step of the funnel.
Work out click-through and conversion rates from the counts
The report includes rate columns, but they divide by search volume, so they measure something other than click-through and conversion rate. Work out both rates yourself from the raw counts.
| What you want | How to work it out |
|---|---|
| Click-through rate | Clicks divided by impressions |
| Conversion rate | Purchases divided by clicks |
Do the same sum with the market's counts on the same search and compare the two. My CTR/CVR Benchmark shows the comparison as an index, where 1.00 means you match the market, a number above 1 means you beat it and a number below 1 means you trail it. As plain arithmetic, a product with a 6% click-through rate on a search where the market's rate is 4% gets 1.5 times the market's clicks for each impression.
I treat a search as low sample when the product had fewer than 100 impressions or 15 clicks on it, and I mark it and wait for more data so that a thin week never passes for a firm result.
Variations blur the conversion rate
When a product has variations such as sizes or colors, Amazon credits the family's search clicks to the child that shows in search, while the sales go to whichever sibling sold. Suppose the child that appears in search is the blue one and most shoppers who click it end up buying the red one. The blue child then shows the clicks with few purchases, and the red child shows purchases with few clicks.
That makes the conversion rate of any single child unreliable. Before you judge one variation, read the whole family together and ask whether the family converts. The Benchmark flags this limit whenever it applies, and its sample on the skill page comes from a product that is one of three variations in its family.
Why your share can pass 100%
Setting your ad impressions against the searches in this report gives you your impression share, which is your ad impressions (the times your ad was shown) divided by the number of searches. That share can come out above 100%, because the report counts searches and one shopper can see your ad more than once.
I treat those rows as searches my ads already cover, and the useful rows sit at the other end, where a search has real volume and your ads win few impressions or none. The PPC Gap Finder ranks those gaps by the impressions you're missing. It needs a Search Term Report for exactly the same dates, because mismatched dates create gaps that aren't real.
Keep brand searches apart
Searches with your brand name in them click and convert better because those shoppers already know you, so mixing them with every other search makes your whole funnel look healthier than it is. For that reason I read branded and unbranded searches separately on every account.
A brand search is one that contains your brand name, one of your product line names or a common misspelling of either. Write that list down before you read the report, because it decides which side of the split each search lands on. Your competitors' brand names are worth listing as well, so you can see their brand searches where you also show up. The PPC audit checklist runs the same split on your ad data.
From numbers to a call: Kill, Defend, Growth or Monitor
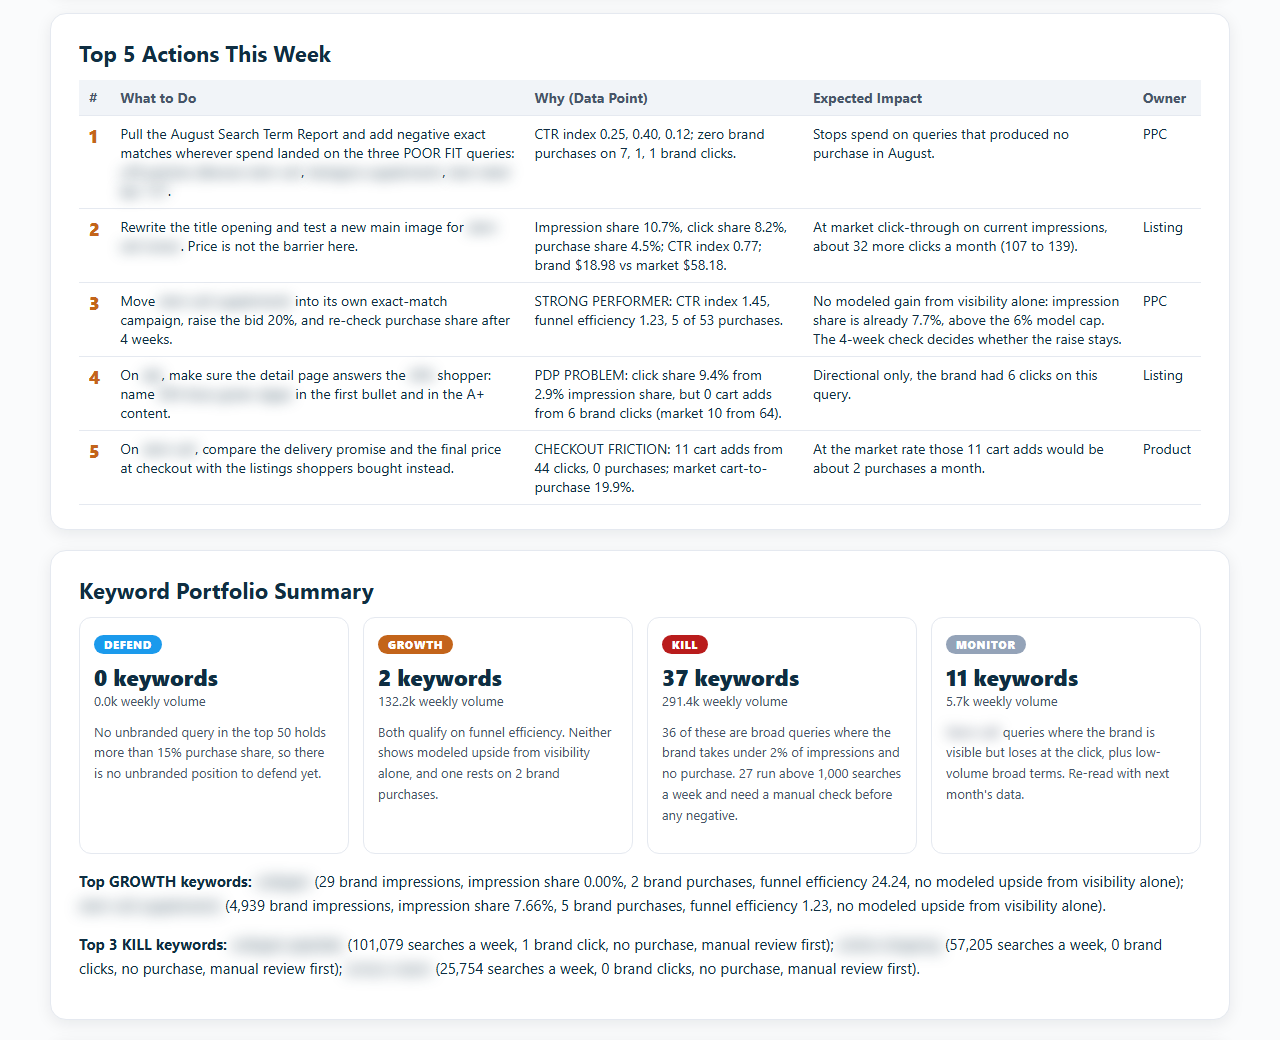
The report becomes useful when every keyword ends in a decision, and my Search Query Performance Deep Analysis gives each keyword one of four calls.
| Call | What it means | What to do next |
|---|---|---|
| Kill | A poor fit | Stop paying for it. See when to add negative keywords. |
| Defend | You already win a solid share of its purchases | Protect it. |
| Growth | Shoppers who find you buy | Get seen more, starting with the bid. |
| Monitor | Thin or mixed data | Watch it and read it again next month. |
On every run, a keyword whose product page is losing shoppers never lands in Growth, so I never buy more traffic for a page that doesn't convert yet. A keyword with more than 1,000 searches a week that is headed for Kill is also flagged for review by hand before anyone negates it.
Every action names the number that triggered it, and each one is something you can do within seven days. The changes apply to your ads and to your listing, which means the title, bullet points and images.
Common mistakes
- Adding up purchases and comparing the total with the Business Report, when the two reports count different orders.
- Reading the report's rate columns as your conversion rate, when they divide by search volume.
- Judging one child of a variation family on its own conversion rate.
- Acting on a search with fewer than 100 impressions or 15 clicks as if it were a firm result.
Reading it every month
I read the whole account once a month on the previous month's export and compare how each keyword moved between calls. For a product I am working on, I download the ASIN view every week and log each listing change, so I can see what the numbers did in the weeks after it. On a new or very small account, I wait until search traffic builds up before I give keywords their calls.
Frequently asked questions
Who can access the Search Query Performance report?
The report lives in Brand Analytics, which Amazon shows only to brands enrolled in Brand Registry, and you also need a Professional selling account. You have access if Brand Analytics is listed when you hover over Brands in the main menu of Seller Central.
Why does my ASIN view download come back empty?
You probably chose a variation parent, and a parent returns an empty file. Choose a child ASIN, which is the product ID of one size or color. When a family has several children, I pick the one with the most sessions (page visits) in the Business Report.
How often should I read the report?
I read the whole account once a month on the previous month's export and compare how each keyword moved between months. For a product I am working on, I download one file a week, because two weeks already draw a first trend line.
How do I work out click-through and conversion rate from it?
Use the raw counts and leave the report's rate columns aside. Click-through rate is clicks divided by impressions, and conversion rate is purchases divided by clicks. Work out the same two rates for the market and compare your numbers with it.
Can a new brand use the report?
A product appears in the report once it is shown in search, so a new brand can start following one product early. The monthly read of every keyword needs more traffic, because a search with little traffic gives numbers too noisy to act on. I wait until search traffic builds up before I give keywords their calls.
Why are some of my searches missing from the file?
Each weekly file in the ASIN view holds up to roughly 100 searches for one product, so your rarest searches may not appear, which is normal for the file.
Want a second pair of eyes on your account?
Book a free 20-minute strategy call. Bring your numbers, and we go over what I would fix first.
Book a free strategy call